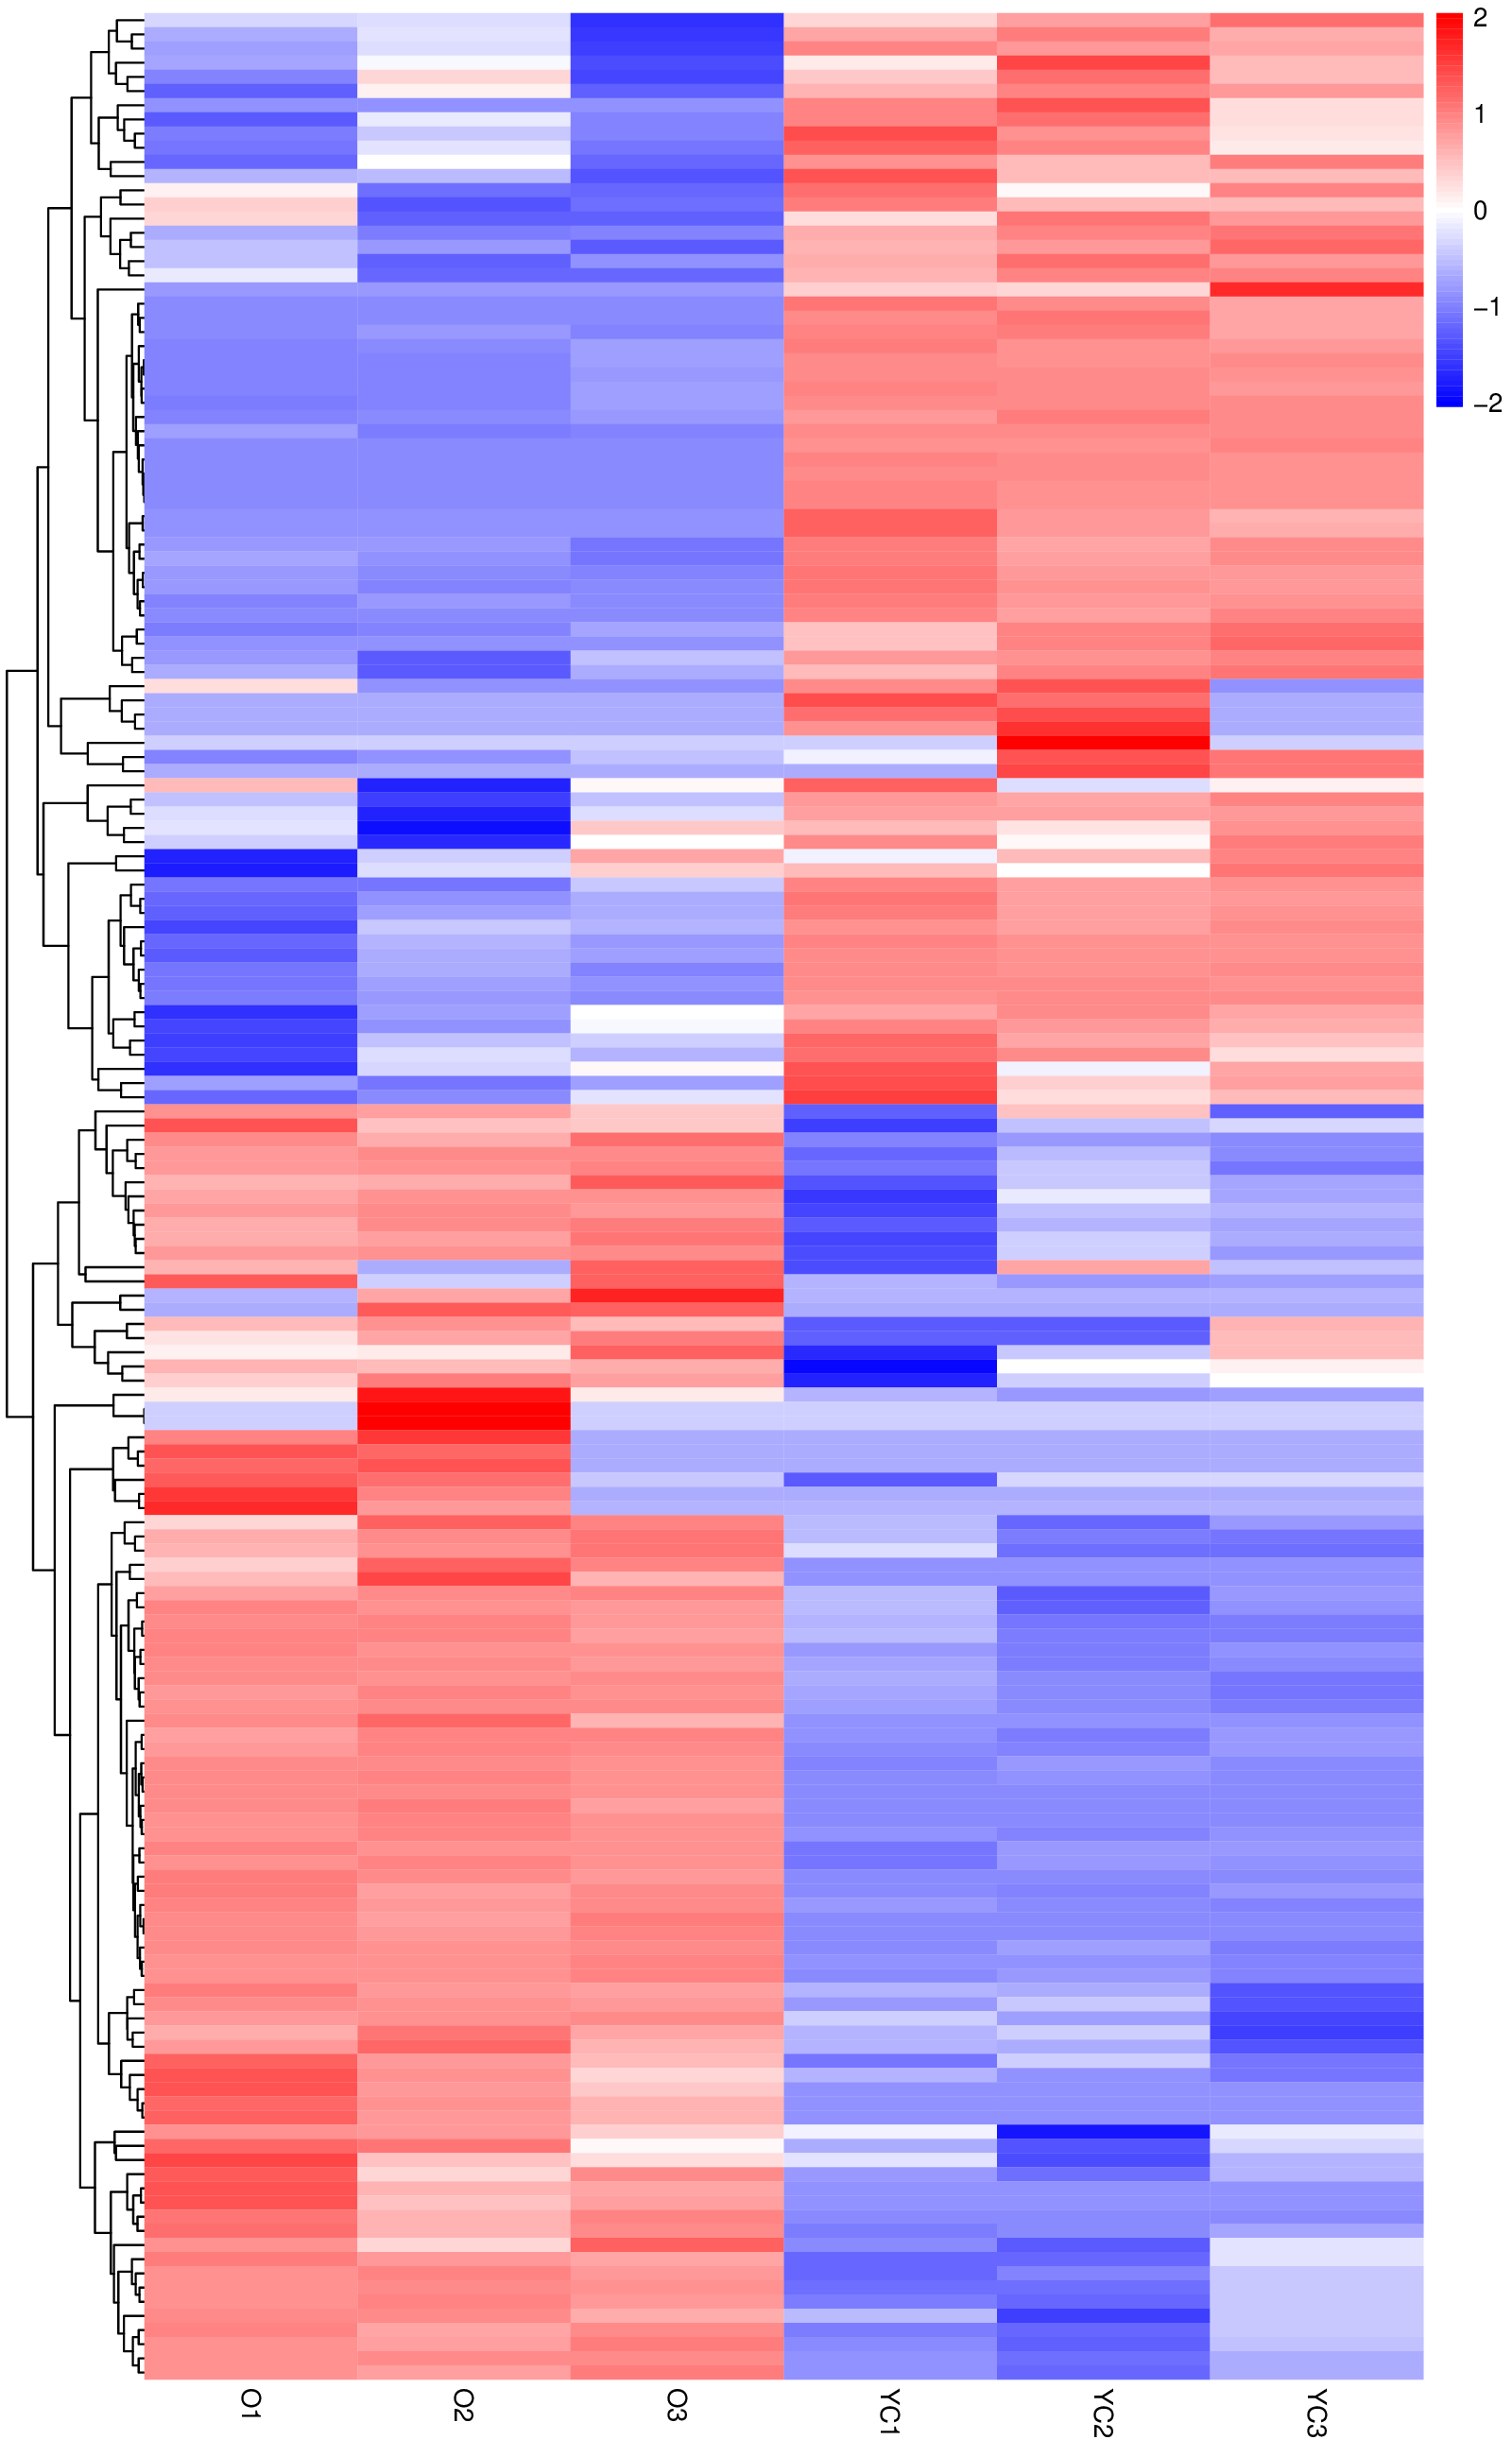

 调参版 |
 分组版 |
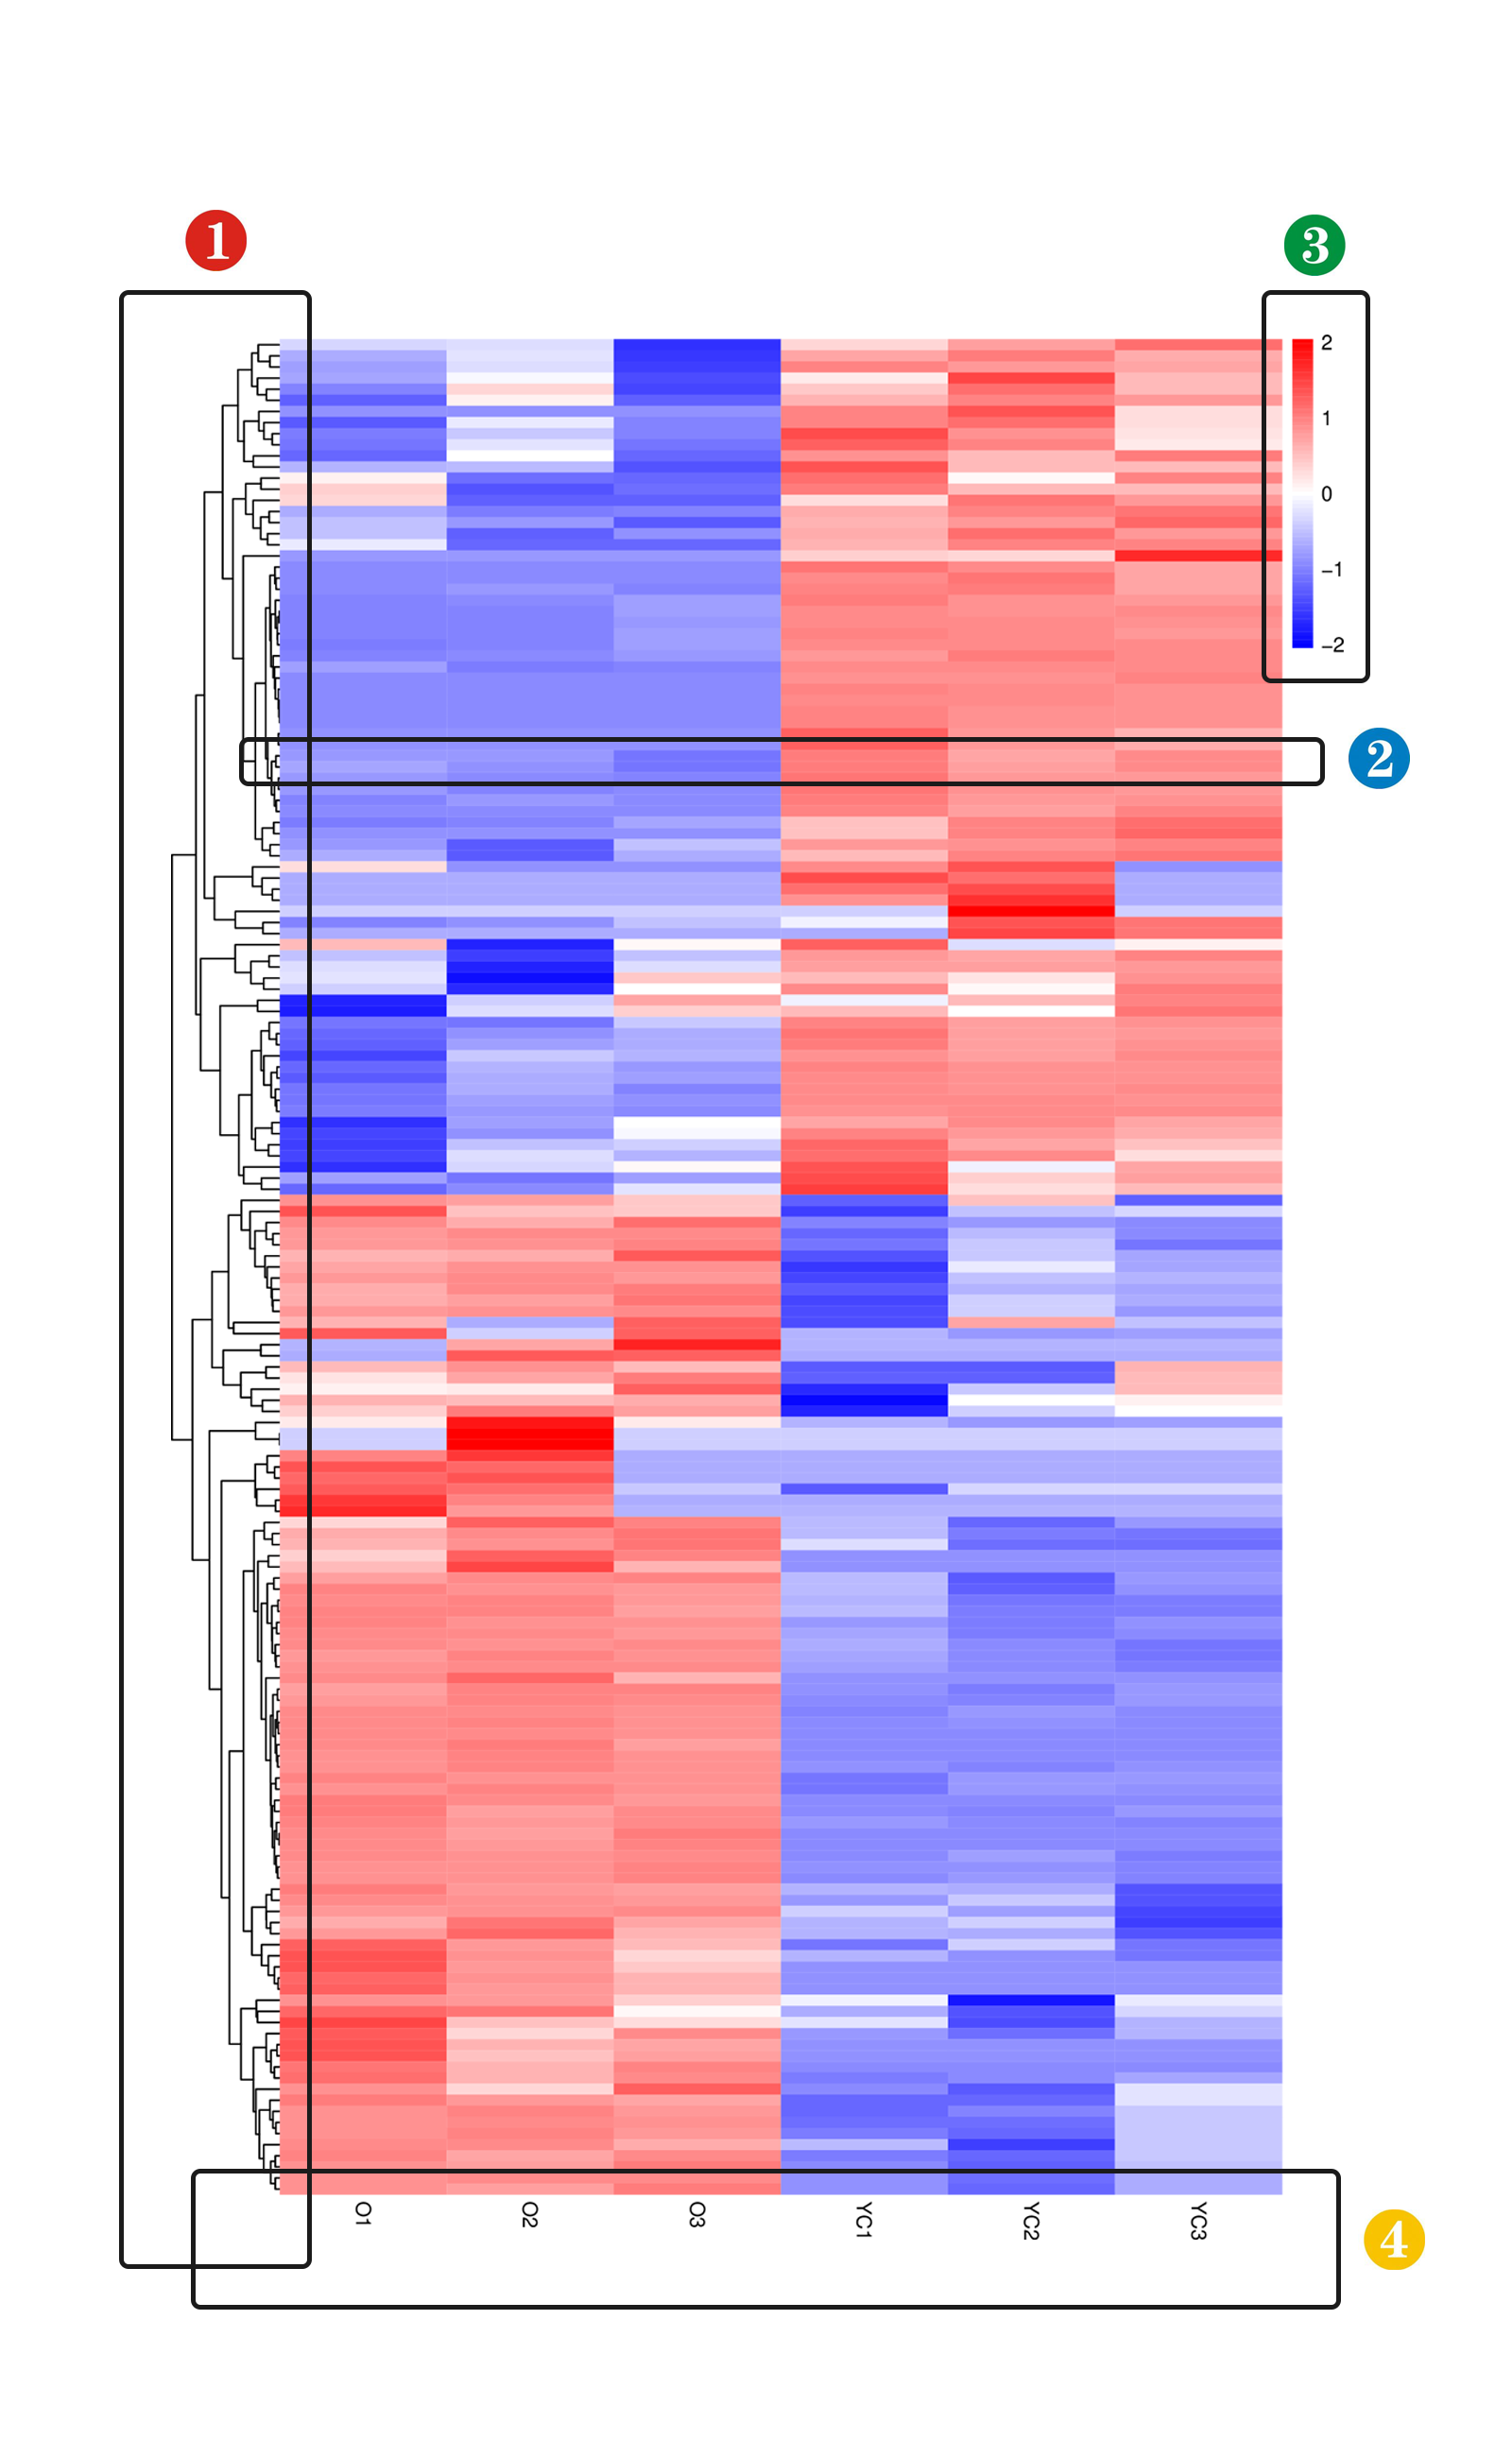
| 1. 纵向聚类,根据相应的cluster聚类算法,特征相近的单元会倾向于具有较近的空间距离。 | |
| 2. 样本名称,对应于原始数据的表头位置信息。 | |
| 3. 渐变数值图例,对应基因的Scale表达值。 | |
| 4. 横向数值变化趋势颜色块,对应基因的Scale表达值。 |
根据矩阵数据状态,去除掉没有表达的基因,以及方差为零的无数值变化基因,使用 R(3.6.1)语言的 pheatmap(1.0.12)包 进行热图绘制。
pheatmap(mat, color = colorRampPalette(), kmeans_k = NA,

	breaks = NA, border_color = "grey60",

	scale = "none", cluster_rows = TRUE,

	cluster_cols = TRUE, clustering_distance_rows = "euclidean",

	clustering_distance_cols = "euclidean", clustering_method = "complete",

	cutree_rows = NA, cutree_cols = NA, annotation_row = NA, annotation_col = NA,

	show_rownames = T, show_colnames = T,

	fontsize = 10, filename = NA, width = NA, height = NA)
    mat: numeric matrix of the values to be plotted.

    color: vector of colors used in heatmap.

    cluster_rows: boolean values determining if rows should be clustered or hclust object.

    cluster_cols: boolean values determining if columns should be clustered or hclust object.

    show_rownames: boolean specifying if column names are be shown.

    show_colnames: boolean specifying if column names are be shown.

    width: manual option for determining the output file width in inches.

    height: manual option for determining the output file height in inches.
v1.0.6 基本架构构建,表格直接出图。
v2.1.5 调整样本名称的显示方式为纵向。
(1)上传文件的大小,应当控制在10M之内。
(2)上传文件同时支持 xlsx/xls/csv/txt/fake-xls,5种主流文件格式作为输入(fake-xls结尾的文件,实际为文本文件修改后缀得到,即为文本格式文件作为输入)。
(3)样本名称和基因名,不能够有重复情况发生。
(4)存在基因数目或者样本数目越多,运行等待时间越长的趋势。